# Is 82% Good Enough? How to Prove an AI Agent Meets Its Bar
82% on forty cases and 82% on five hundred are different claims. Against an 80% bar, neither is proof, and here is why.
6 min read · Intermediate · Lesson 7 of 13 in Running delivery · Updated 2026-10-02 · By Akash Das
Canonical: https://akash-coded.github.io/aws-bedrock-agentcore-strands/learn/prove-ai-accuracy/
> **In short.** A score on a test set proves an AI agent meets its bar only when the
> **lower bound** of the score (the bottom of its 95% confidence interval) clears the bar. So report
> every slice as a score, a sample size and a lower bound. Give each a verdict: proven, not yet (and
> how many more cases it owes), or failed.

**In this lesson** you'll learn:
- why a score is an estimate, and how to compute the lower bound that proves or fails a bar;
- how many cases a slice needs, and why proving gets expensive near the bar;
- how to build a golden set by slice, and report a verdict that holds up.
## Sound familiar?
- "The agent is 94% accurate", and nobody asks on how many cases.
- A slice came back at 82.4% against a bar of 80, and the room called it a pass.
- The test set was drawn at random from traffic, so the rare, expensive cases barely appear in it.
Each is a number being asked to carry a claim it cannot. The fix is to report what the number actually
entitles you to say.
## Why is a score not proof?
A score measured on a sample is an **estimate**; a different sample would have given a slightly
different number. The width of that uncertainty depends on the sample size, and the width is the
argument. The **lower bound**, the bottom of the 95% confidence interval, is the smallest true
accuracy consistent with what you measured. The bar is proven only when the lower bound clears it.
| Score | Cases | Lower bound (normal) | Lower bound (Wilson) | Against an 80% bar |
| --- | --- | --- | --- | --- |
| 82% | 40 | 70.1% | 67.5% | not proven |
| 82% | 150 | 75.9% | 75.1% | not proven |
| 82% | 500 | 78.6% | 78.4% | not proven |
| 86% | 500 | 83.0% | 82.7% | **proven** |
## Prove a bar, step by step
### Step 1 · Score each slice separately
Run the golden set and score each slice on its own. An overall number is dominated by the easy,
high-volume cases and can rise while the slice carrying the risk falls. SkyWays' overall score went
from 79% to 84% while codeshare fell from 81% to 77% against a bar of 80.
### Step 2 · Report the lower bound, never the score alone
For large samples use the normal approximation: **lower bound = p − 1.96 × √(p(1 − p) ÷ n)**. Under
about a hundred cases, or near 0% or 100%, use the **Wilson** interval, which the normal approximation
overstates at small *n*. Put the score, *n* and the lower bound on the same row, every time.
### Step 3 · Count the cases a slice still owes
When a slice is not yet proven, say how many cases would prove it, if its score held:
> **n = 1.96² × p(1 − p) ÷ (p − bar)²**
At SkyWays codeshare scored 412 of 500, 82.4%, against 80%. Its lower bound was 79.1%, and proving
the bar at that score takes **968** cases. The cost grows with the square of the gap: halve the
distance between score and bar and you quadruple the cases. A score a whisker above the bar is the
most expensive result you can get.
### Step 4 · Build the golden set by slice, oversampling the rare ones
The golden set is real past cases, each with an expected outcome a person wrote and a slice tag:
**fifty to start, five hundred to trust**. Draw it per slice rather than as one random sample: a
sample representative of *traffic* is not representative of *risk*, so the rare, costly slice needs
deliberate oversampling. SkyWays' first fifty took an afternoon, and twenty-four of them failed, which
is what made the set worth running.
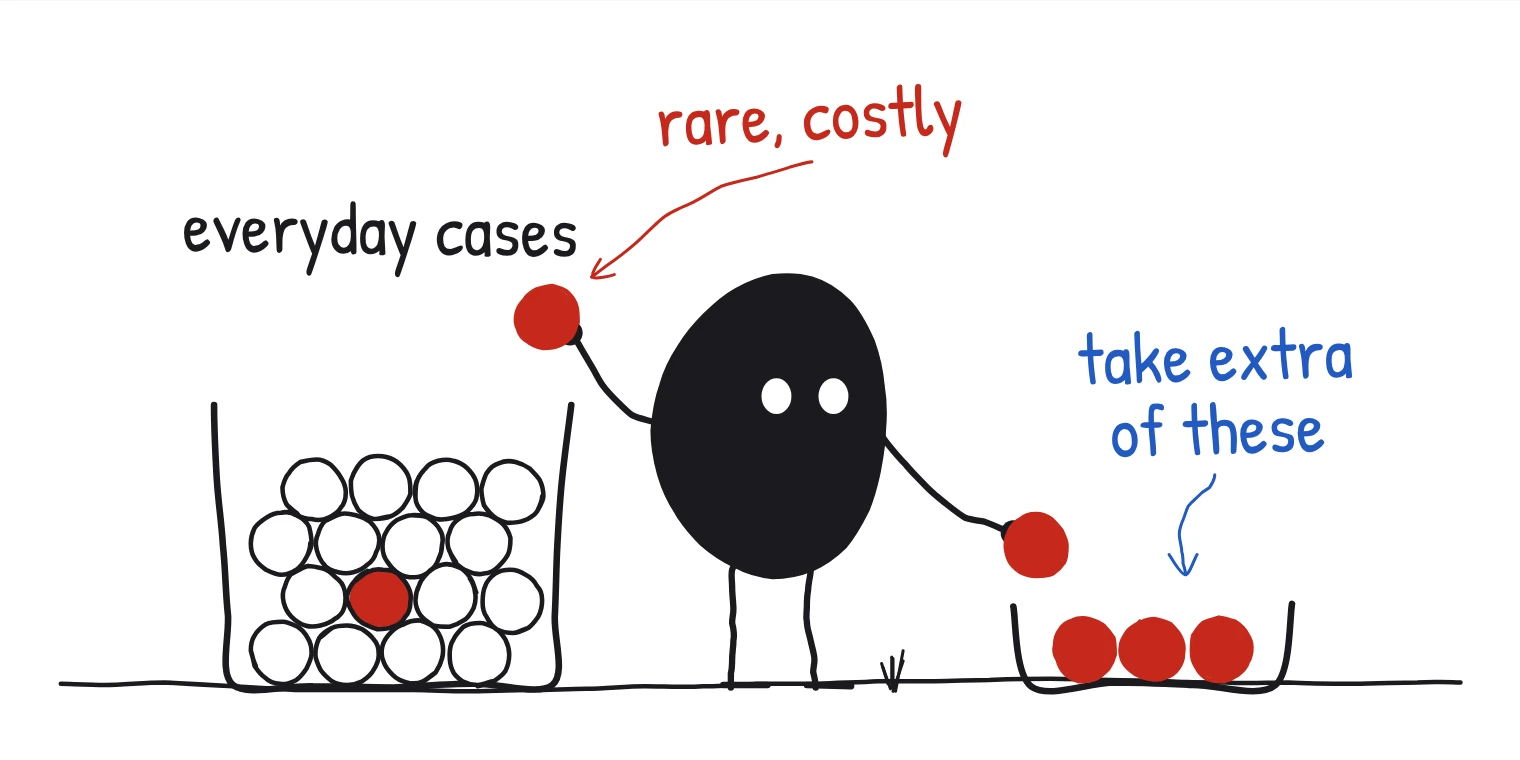
*A sample that looks like traffic holds few of the rare, costly cases. Draw each kind separately and take extra of those.*
### Step 5 · Calibrate any automated judge against people
If a model judges drafted answers, measure how often it agrees with human labels on a held-back
sample, and put that *n* beside it. A judge you have not calibrated is another unproven score.
### Step 6 · Give each slice a verdict
**Proven**: the lower bound clears the bar. **Not yet**: the score is above the bar but the lower
bound is not, with the cases owed. **Failed**: the score is below the bar. "Not yet, 468 cases owed"
is a plan; "it failed" is an argument.
## Where you'll use it
- **At the behaviour gate in P2**, before anything is shown to real users.
- **Every time anyone quotes a percentage** in a status report or a deck.
- **When planning the evaluation budget**: cases owed per slice is the number to plan with.
## Why it matters
Shipping on a point estimate is how a slice that got lucky reaches production. Rejecting a slice that
is merely unproven is how a good feature is abandoned. The lower bound and the cases owed separate the
two, and they turn an argument about a percentage into a plan.
## Try it
A slice scores 88 right out of 100 against a bar of 80%. **Is the bar proven? Use Wilson, since n is
at the hundred mark.**
Show the answer
**Yes, just.** The Wilson lower bound of 88 out of 100 is about **80.2%**, which clears 80% by a hair,
so the verdict is proven, and it is fragile: a handful more failures in the next run would turn it into
*not yet*. The honest report is the row itself (88%, n = 100, lower bound 80.2%, bar 80%, proven)
with a note to keep adding cases to this slice.
```
## Sources and credits
| Idea | Origin | Source |
| --- | --- | --- |
| The Wilson score interval | **Borrowed** | Wilson, E. B. (1927). Probable inference, the law of succession, and statistical inference. *JASA* 22(158) |
| Stratified sampling, one sample per slice | **Borrowed** | Neyman, J. (1934). *Journal of the Royal Statistical Society* 97(4) |
| Lower bounds, cases owed and the three verdicts | **Original**: this manual | [How to prove the bar](https://github.com/akash-coded/aws-bedrock-agentcore-strands/wiki/How-to-Prove-the-Bar) · [Formulas](https://github.com/akash-coded/aws-bedrock-agentcore-strands/wiki/Formulas-and-Calculators#cases-needed-to-prove-a-bar--established) |
| Fifty to start, five hundred to trust | **Original**: this manual, a working default | [Sources and Confidence](https://github.com/akash-coded/aws-bedrock-agentcore-strands/wiki/Sources-and-Confidence) |
| The SkyWays figures | **Illustrative**: a fictional airline | [Try the confidence calculator](https://akash-coded.github.io/aws-bedrock-agentcore-strands/workbench/#/toolkit/confidence) |